

Hey everyone! In this blog, we are going to see what is Prometheus and how we can use it to get meaningful analysis of the data that we are getting out of microservices and infrastructure. Although this might sound a bit advanced and not much of an application for a beginner or just getting started after this blog, I hope I am able to give you reasons why you should include and use Prometheus in your infrastructure. So let's get started
What is Prometheus 🤔
Prometheus is used as a monitoring tool for highly dynamic container environments or even bare metal servers. Okay so with day to day increasing complexity of the applications it is becoming difficult to handle everything manually and needs automation. For example, if you have many services and object running on the server there is no insight into what is going on hardware level or application level. There might be cases when a service goes down and that causes other services to malfunction. In such cases, you should be able to quickly find the cause and solve it.
In a regular scenario, it won't be easy as you will have to trace a long way back to find out the service at the root which is causing trouble and fix it. So Prometheus constantly monitors all the services, and alerts the admins or individual users when crash. Prometheus also helps you to detect these problems beforehand (eg: resource depletion, memory shortage, ram/ memory usage)
Prometheus Architecture ✨
Prometheus server:
This is actually responsible for monitoring work. Prometheus server is comprised of 3 different components
Data Retrieval Worker: This component pull the matrics data from the application and services
Time Series Database: This is a database that saves all the matrix data.
HTTP Server: This component accepts the queries and provides the data from Time Series Database to The web UI (eg: Grafana)
(You can see how these components are put in architecture from the image below)

What are Targets 🎯:
Targets are any objects which are monitored by Prometheus. These targets include Linux/Windows server, Apache Server, Single Application, Servies, or Database. And these targets have units for monitoring. For eg units for Linux servers can be CPU states, Memory usage, etc.
What are Metrics 📊:
Prometheus provides a human readable format for metrics collected from the targets. Metrics entries are separated by TYPE and HELP attributes. HELP attribute is used to describe what the matrics are and there are 3 types of metrics
Counter: These metrics keep track of how many times a particular error was caused or alerts were sent.
Gauge: This metric keeps track of what is the current value of the unit is.
Histogram: This matrix keeps track of how long and how big the size of the request was.
Target endpoints and exporters 🚛:
Some services have a default endpoint exposing data to prometheus but many services need another component and that component is an exporter. Exporter is a service or a script that fetches the data from the matrix, converts them to a format that Prometheus understands, and exposes this converted data on its own /metrics endpoint.
Advantages of Alert Manager 🔔:
An alert manager is used to check the rules set by the admin or the user and triggers when any of the given rules is reached. The alert manager then sends the alerts and signals on the provided channels like email, slack, discord, etc.
Common characteristics of Prometheus 📝:
Reliable: Prometheus is highly reliable as you are able to get a clear insight on what is going on inside your services and application
Stand-alone and self-containing: Prometheus doesn't need any outer service to support its functioning.
It also works even if other parts of the infrastructure are broken. It is meant and supposed to work as a separate service.
Prometheus doesn't need any extensive setup for implementation. It has it's own helm chart which makes it absolutely easy to configure and use it for monitoring on your infrastructure and applications
Prometheus is less complex compared to other monitoring tools.
Setting up Prometheus on K8s ⚙️:
Create a separate namespace called
monitoringkubectl create namespace monitoringAdd Prometheus repo to helm:
helm repo add prometheus-community https://prometheus-community.github.io/helm-chartsUpdate the helm repo list
helm update repoInstall Prometheus operator on your cluster using helm:
helm install prometheus prometheus-community/kube-prometheus-stack -n monitoringPort-forward Grafana dashboard service to access the Prometheus metrics:
kubectl port-forward svc/prometheus-grafana 3000:80 -n monitoringVisit
http://localhost:3000to access the Grafana dashboardOnce on the dashboard, you can use the following username and password to login as they are the default for everyone at the start and ofcourse you can update them if you want.
 username: admin
 password: prom-operator
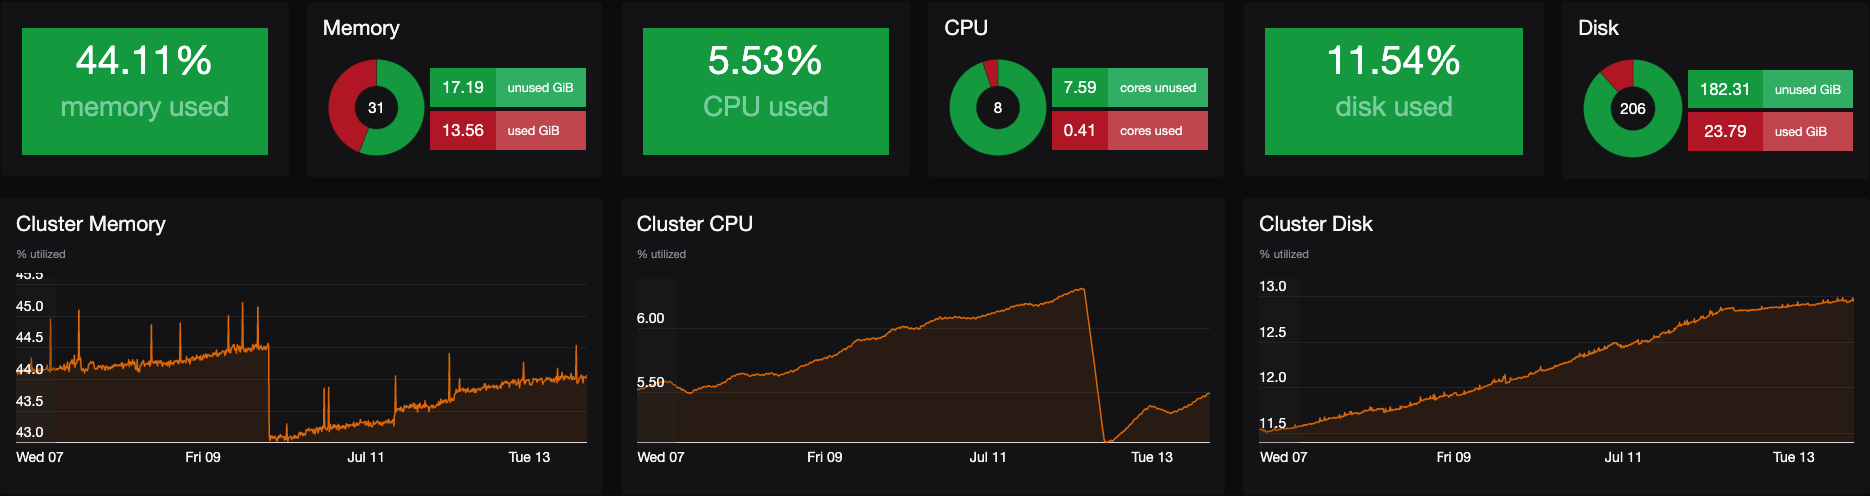
And that's it, you have successfully added Prometheus as a monitoring engine for your infrastructure and modify the Grafana dashboard according to your will and preference to suit your needs. The most essential parts of Prometheus are time series data and time series database, types of metrics you can expect. If you dig deep into above topics then you will have much deeper understanding how you can modify Prometheus at each step to suit your specific use case.
References 📖
Setup Prometheus Monitoring on Kubernetes using Helm and Prometheus Operator
Writing a Prometheus exporter from IDE to deployed in 20 minutes
How Prometheus Monitoring works | Prometheus Architecture explained
Thank you so much for reading 💖
Like | Follow | Subscribe to the newsletter.
Catch me on my socials here: https://link.kaiwalyakoparkar.com